Going deeper on bikes and bikers
May is National Bike Month, and to mark the occasion WGBH News is kicking off its “Right of Way” series about the relationship between cyclists, drivers and pedestrians on our roads. As part of that effort, WGBH commissioned MPG to field three questions about bikes and cars in our most recent quarterly omnibus poll.
(Read WGBH’s press release on the results, and watch MPG president Steve Koczela discuss the results on Greater Boston with Emily Rooney.)
In analyzing the results for WGBH, we got to thinking about our previous polling on transportation and what it reveals about bikers and biking here in Massachusetts.
Bikers are drivers, too: Rather than talking about bikers and drivers as two separate tribes of road users, it’s better to think of biking and driving as two different modes of travel used by many of the same people. Our September 2012 poll found that 91 percent of those who had ridden a bike to work or shopping in the past month had also driven a car for those reasons. The figure was lower in February 2013 (70 percent), but so was the total number who had biked in the previous month – a very snowy January. Nonetheless, a solid majority of even these hardier cyclists are also driving to work or shopping at least part of the time.
In both polls, those who biked were also more likely than the general population to use other modes of travel: trains, subways, buses, ferries and walking. Overall, it appears that bikers are using more aspects of the transportation network than the general population.
In keeping with this overlap with other modes,bikers are not all that dissimilar demographically than our respondents overall. Looking at the demographic data from September 2012 poll (which contained the larger sample of bikers), we see that bikers track pretty closely with the general population, with perhaps a slightly higher income and educational profile.
Partisan split: One appreciable difference we found was that bikers are more likely to be registered Democrats. Forty-one percent of bikers in our September 2012 poll and 50 percent of the hardier winter bikers from our February 2013 poll were Democrats, compared to 36 percent of respondents overall in both polls. This finding may help explain the partisan divide we found in the WGBH poll. While solid majorities from each party thought both drivers and bikers were equally to blame for accidents, more Democrats (26 percent) blamed drivers alone, while more Republicans (21 percent) pointed the finger at cyclists.
When it came to remedying the problem, a majority (51 percent) of Democrats favored installing more bike lanes. Among Republicans, the most popular solution was better enforcement existing traffic laws (42 percent). These preferences mirror the ideologies of the two parties, with Democrats favoring infrastructure solutions and Republicans adopting a law-and-order stance.
Bike lanes are favored, but not as much as other improvements: The WGBH poll found that 45 percent of residents think bike lanes are the best solution to resolving conflicts between bikes and cars. But our previous polling shows that other infrastructure improvements are viewed as even higher priorities – even be those who bike.
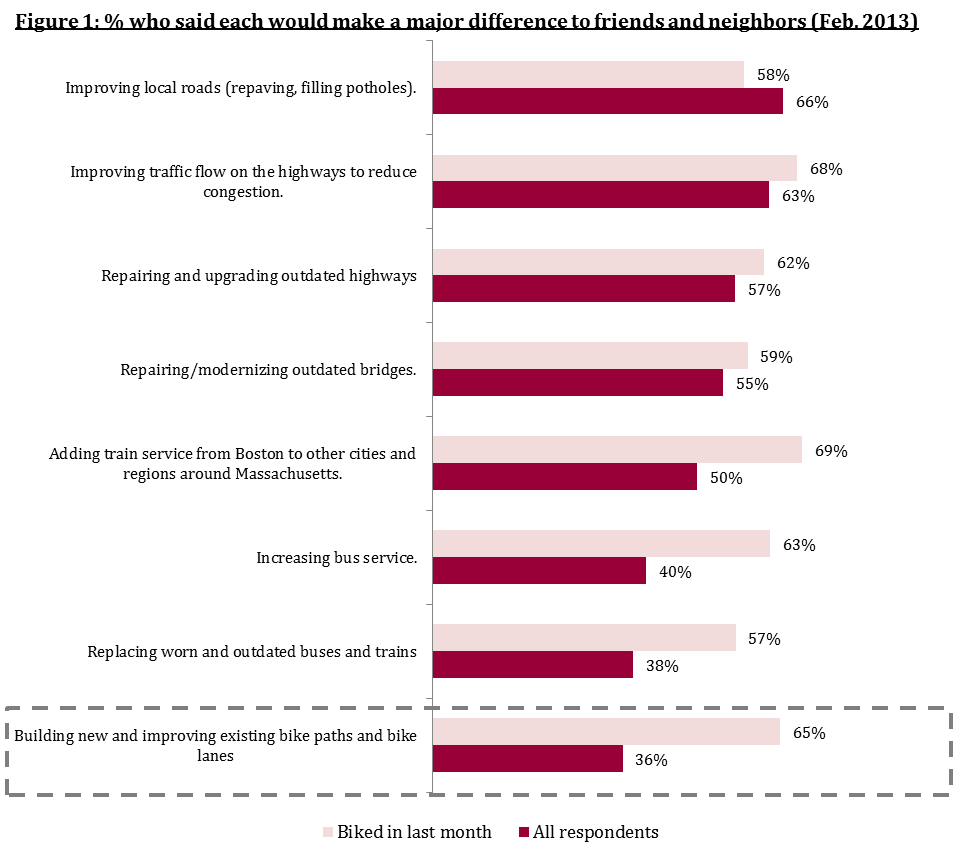
The chart below shows the percentage of respondents to our February 2013 poll who said that the making the listed improvements in their area would make “a major difference” in the lives of their friends and neighbors. Improving and/or adding new bike lanes is the third most popular option among cyclists (65 percent), but the least popular among all respondents (36 percent).

Across the board, bikers are more supportive of all manner of improvements – roads, bridges, transit and bike lanes – than the overall population. This is likely due both to cyclists’ political leanings and their multi-modal use of the transportation system.
